A Forrester Total Economic Impact™ Study Commissioned By Apple
The Total Economic Impact™ Of Mac In Enterprise
Cost Savings And Business Benefits Enabled By An Employee Choice Program
Executive Summary
Apple commissioned Forrester Consulting to conduct a Total Economic Impact™ (TEI) study and examine the potential ROI enterprises may realize by deploying Mac. The purpose of this study is to provide readers with a framework to evaluate the potential financial impact of Mac on their organizations.
Mac provides another option for end user machines, compared to a standard enterprise PC deployment. To better understand the benefits, costs, and risks associated with this investment, Forrester interviewed seven customers with experience deploying Mac in their enterprise.
Prior to using Mac, the interviewed organizations were largely PC-based. However, organizations reported that their focus on enterprise PC deployment introduced some challenges: 1) the PC imaging process was manual and time-consuming for IT full-time equivalents (FTEs); 2) employees were using their own Mac in an unsupported state; and 3) organizations were seeing an increase in the number of Mac devices in their environment, due to acquisitions. Organizations were hoping to improve security reliability/performance of their hardware.
The interviewed organizations decided to implement an employee choice program and enterprise Mac deployment due to: Mac being easier to manage; a desire to improve the employee experience; and Mac being a more secure platform. This resulted in significant benefits, as detailed in this case study. With Mac, organizations reduced IT support costs, improved employee productivity and engagement, and improved overall security.
Forrester developed a composite organization based on data gathered from the customer interviews to reflect the total economic impact that Mac could have on an organization (see Composite Organization for more information). All values are reported in risk-adjusted, three-year present value (PV) unless otherwise indicated.
Key Benefits

Reduced hardware, software, support, and operational costs:
$678.56 per device

Improved employee performance and engagement:
20% improved retention
5% increased sales
48 hours of improved productivity
Key Findings

Quantified benefits. The following benefits reflect the three-year financial analysis associated with the composite organization.
- On a per-device basis, Mac costs $628.31 less than comparable PCs when considering three-year support and operational costs.
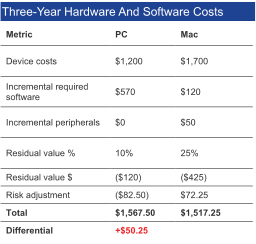
For the composite organization, this results in reduced IT support costs totaling $11.6 million. Less time is needed to provision Mac, fewer service tickets are opened, and the tickets that are opened are easier to resolve. Overall, a higher number of Mac devices can be managed per IT FTE. Additionally, they require less energy to operate. - On a per-device basis, Mac costs $50.25 less than comparable PCs when considering three-year hardware and software costs, despite the upfront acquisition cost for Mac being $500 higher.
This results in reduced and avoided costs totaling $36.5 million. While on average the Mac costs more upfront, this is partially offset by the cost of a comparable PC that the employee would otherwise need to order, and differences in residual value for the devices. Additionally, there is no need to purchase an OS license or software maintenance contract for Mac, and the underlying architecture and included security features obviate the need for some additional endpoint security licenses. - Reduced risk of a data breach by 50% per deployed Mac.
For the composite organization, this results in a total expected value of $1.5 million. Interviewed organizations noted that their Mac has a fundamentally more secure architecture than their PCs, which results in a reduced risk of security incidents. - Improved employee performance and engagement, resulting from a 20% improvement in retention rate, 5% increase in sales performance, and 48 hours of increased productivity per employee over three years.
For the composite organization, this leads to a $67 million impact. This is due to improved machine performance, reduced employee frustration with work technology, and improved employee engagement leading to an increase in discretionary effort, performance, and employee retention rate.
Costs. The following costs reflect the three-year financial analysis associated with the composite organization to support 30,000 Macs.
- Implementation and labor costs totaling $903,983.
This is from professional services for implementation, internal labor for implementation, and internal labor for ongoing platform support. - Hardware and hardware deployment costs totaling $32 million.
Interviewed organizations noted hardware and deployments costs related to the Mac itself, third-party mobile device management (MDM) costs, an incremental cost for additional Mac peripherals, and AppleCare extended warranty and enterprise support.
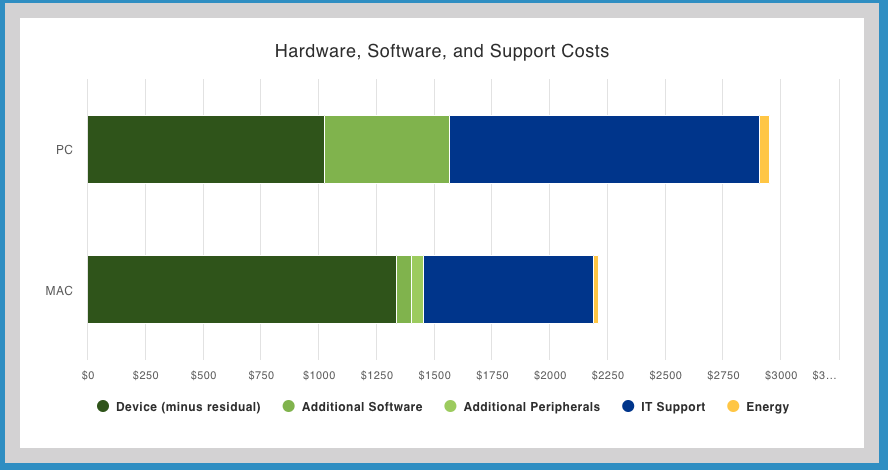
Forrester’s interviews with seven existing customers and subsequent financial analysis found that an organization based on these interviewed organizations experienced benefits of $117 million over three years versus costs of $33 million, adding up to a net present value (NPV) of $84 million and an ROI of 255%. Additionally, per-device comparisons of hardware, software, and support costs are shown in the graph below.
“You have to separate causation from correlation, but there’s no doubt an employee choice program is beneficial for our organization. Employees who choose Mac are more innovative, in sales they close larger deals, and they’re much less likely to voluntarily quit. And, they respond with higher overall IT satisfaction on employee surveys.”
– CIO, technology industry
“It’s much, much easier to manage our Macs. The marriage of the hardware and software is difficult to beat. Every time we buy a new PC, it’s a whole new set of drivers, software, and imaging that we have to deal with.”
– IT director, retail industry
TEI Framework And Methodology
The TEI methodology helps companies demonstrate, justify, and realize the tangible value of IT initiatives to both senior management and other key business stakeholders.
From the information provided in the interviews, Forrester has constructed a Total Economic Impact™ (TEI) framework for those organizations considering implementing Mac.
The objective of the framework is to identify the cost, benefit, flexibility, and risk factors that affect the investment decision. Forrester took a multistep approach to evaluate the impact that Mac can have on an organization:
DISCLOSURES
Readers should be aware of the following:
This study is commissioned by Apple and delivered by Forrester Consulting. It is not meant to be used as a competitive analysis.
Forrester makes no assumptions as to the potential ROI that other organizations will receive. Forrester strongly advises that readers use their own estimates within the framework provided in the report to determine the appropriateness of an investment in Mac.
Apple reviewed and provided feedback to Forrester, but Forrester maintains editorial control over the study and its findings and does not accept changes to the study that contradict Forrester’s findings or obscure the meaning of the study.
Apple provided the customer names for the interviews but did not participate in the interviews.
The Enterprise Mac Customer Journey
BEFORE AND AFTER THE ENTERPRISE MAC INVESTMENT
Interviewed Organizations
For this study, Forrester conducted seven interviews with Mac customers. Interviewed customers include the following:
| INDUSTRY | GEOGRAPHIES | INTERVIEWEES | EMPLOYEES | MAC DEPLOYMENT |
|---|---|---|---|---|
| Financial services | Global | Platform manager | >100,000 | 2,000 |
| Healthcare | North America, EMEA | Endpoint services director | >100,000 | 5,000 |
| Manufacturing | Global | IT manager | 50,000 | 500 |
| Retail | North America | IT director; director of communications | 600 | 500 |
| Technology | Global | Platform manager; service manager | 75,000 | >20,000 |
| Technology | Global | Chief information officer (CIO) | >100,000 | >20,000 |
| Technology | Global | Platform manager | >100,000 | >20,000 |
Key Challenges Prior To Mac Enterprise Deployment
Before the investment in Mac, interviewees described the following challenges with their previous environment:
-
The PC imaging process was archaic, manual, and time-consuming.
An IT director in the retail industry told Forrester: “We want to be able to hand a new hire a laptop that’s ready to go, to walk away and not have to do anything. We’re averaging five new hires a week, so we want to make sure that employees have the easiest and fastest experience into setting up their new machine. And the Mac platform lets us do that very, very easily.”
-
Employees were using Mac in an unsupported state.
An endpoint services director in the healthcare industry stated: “People were jury-rigging their Mac workstations. There was literally no support for Mac from IT. It was a choose-your-own adventure, self-support type thing.”
-
Organizations were seeing an increasing number of Mac devices in their environment due to acquisitions.
Organizations noted that due to acquisitions, the number of Mac devices in the environment was growing quickly, and they needed a more effective way of managing them.
– CIO, technology industry
Why Mac?
Interviewed organizations stated the following reasons on why they chose an employee choice program and deployed Mac to address their challenges:
-
Mac is easier to manage.
An IT director in the retail industry said: “Apple provides tools like Apple Business Manager, which works with third-party MDMs. It allows us to fix things very quickly and be very flexible, and that’s something we haven’t been able to do in other platforms.”
-
A desire to improve the employee experience.
An endpoint services director in the healthcare industry told Forrester: “There are a lot of people that are Mac users, that consider themselves more productive as a result of that device. And so, our desire is to try to make that available for them.”
-
Mac is a more secure platform.
An endpoint services director in the healthcare industry stated: “Our executives looked over at our CISO and asked, ‘As a result of moving to Mac in our enterprise, are we going to be more secure from a workstation perspective?’ And his answer was simply ‘Yes.’”
– CIO, technology industry
Analysis Of Benefits
QUANTIFIED BENEFIT DATA AS APPLIED TO THE COMPOSITE
Based on customer interviews, Forrester found that Mac costs less for the composite organization when considering hardware and software costs to a comparable PC over three years. Forrester also found that the differential in support and operational cost savings was even higher for Mac.
Combining hardware, software, support, and operational costs over three years leaads to a cumulative cost advantage for Mac deployments. Note that “Risk adjustment” below is the aggregated risk adjustments made to each benefit and cost category, as described in the following sections. The graph below has incorporated the risk adjustments within the totals modeled for device, additional software, additional peripherals, IT support, and energy.
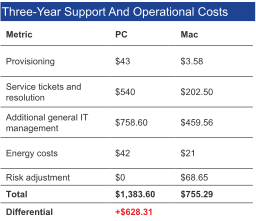
In addition to the financial cost metrics related to hardware, software, support, and operation, Forrester additionally identified significant business benefits related to enterprise Mac deployments. These are described in more detail in the following sections and include quantified impacts from improved employee productivity and engagement and reduced risk of data breach, in addition to the financial metrics associated with device and support costs.
| REF. | BENEFIT | YEAR 1 | YEAR 2 | YEAR 3 | TOTAL | PRESENT VALUE |
|---|---|---|---|---|---|---|
| Atr | Reduced IT support and operational costs | $2,414,880 | $4,829,760 | $7,244,640 | $14,489,280 | $11,629,888 |
| Btr | Reduced and avoided hardware and software costs | $13,271,500 | $15,143,000 | $15,874,500 | $44,289,000 | $36,506,623 |
| Ctr | Reduced risk of a data breach | $305,900 | $611,800 | $917,700 | $1,835,400 | $1,473,192 |
| Dtr | Improved employee performance and engagement | $13,932,800 | $27,865,600 | $41,798,400 | $83,596,800 | $67,099,360 |
| Total benefits (risk-adjusted) | $29,925,080 | $48,450,160 | $65,835,240 | $144,210,480 | $116,709,063 |
The table above shows the total of all benefits across the areas listed in the following sections, as well as present values (PVs) discounted at 10%. Over three years, the composite organization expects risk-adjusted total benefits to have a PV of nearly $117 million.
Benefit 1: Reduced IT Support And Operational Costs
Interviewed organizations described the following benefits related to reduced IT support costs:
- Less time is needed to provision Mac devices as the machines are shipped directly to the employee, and all applications and relevant policies are downloaded automatically and managed via a third-party mobile device management platform. This utilizes Apple’s free Apple Business Manager offering to make this process automatic.
- Fewer service tickets are opened by Mac users, due to self-service capabilities and fewer overall issues with performance. Mac users tend to call the support desk fewer times because they’re familiar with the platform and they’re motivated to make it work, citing that “it just works.”
- The tickets that are opened for Mac are easier to resolve, as there is less complexity in the ecosystem. Additionally, there tends to be fewer hardware-related issues and fewer dependencies on multiple vendors.
- Overall, a higher number of Mac devices can be managed per IT FTE. This is due to Mac having a simplified toolset, more automation, reduced patching, application updates, configuration failures (resulting in rework and troubleshooting), and an overall reduction in required attention for the machines.
For the composite organization, based on the customer interviews, Forrester estimates that:
- It takes an IT employee 5 minutes to set up a Mac for provisioning, as opposed to 60 minutes for a PC. Additionally, the Mac receives major OS updates and patches annually, so the savings from automated software updates accrue on an annual basis.
- Note – we are not including the sunk costs of developing PC images in this analysis, as these are still required unless an organization deploys 100% Mac in the enterprise.
- 10,000 employees annually choose Mac instead of PC for their new machine (or replacement / lifecycle refresh).
- Average fully burdened IT salary is $43/hour.
- An average of six tickets are opened per PC user per year, and each ticket costs $30 to resolve. Mac users open 50% fewer tickets, and each ticket costs 25% less to resolve.
- There is less complexity in the ecosystem and fewer places to go wrong. As Apple has control over the hardware and OS, resolution of issues tend to be simpler and less error prone, requiring fewer steps to resolve any given issues.
- 200 PCs can be managed per IT FTE, whereas 500 Mac devices can be managed per IT FTE (given best practice deployments of enterprise Mac).
- Note – as the reduced provisioning and service ticket effort associated with Mac are implicitly included in this machine-to-IT FTE ratio, those benefits are subtracted out from this benefit in the final qualification.
This benefit can vary due to uncertainty related to:
- Average fully burdened IT salary.
- Note that salary is a conservative estimate of the value an employee provides to the organization.
- Use of Apple’s best practices in deploying Mac in the enterprise.
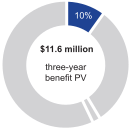
Reduced IT support costs: 10% of total benefits
To account for these risks, Forrester adjusted this benefit downward by 10%, yielding an annual benefit ranging from $2.4 million to $7.2 million, with a three-year, risk-adjusted total PV of $11.6 million.
Impact risk is the risk that the business or technology needs of the organization may not be met by the investment, resulting in lower overall total benefits. The greater the uncertainty, the wider the potential range of outcomes for benefit estimates.
Benefit 1: Reduced IT Support And Operational Costs: Calculation Table
| REF. | METRIC | CALC. | YEAR 1 | YEAR 2 | YEAR 3 |
|---|---|---|---|---|---|
| A1 | Time required to provision a PC (minutes) | Composite organization | 60 | 60 | 60 |
| A2 | Time required to provision a Mac (minutes) | Composite organization | 5 | 5 | 5 |
| A3 | Number of Mac devices provisioned annually | Net new Mac deployments; includes refreshes in Years 4 and 5 | 10,000 | 10,000 | 10,000 |
| A4 | Average fully burdened IT salary (hourly) | Composite organization | $43 | $43 | $43 |
| A5 | Subtotal: reduced provisioning effort (rounded) | (A1-A2)/60*A3*A4 | $394,167 | $394,167 | $394,167 |
| A6 | Average number of tickets per PC per year | Composite organization | 6 | 6 | 6 |
| A7 | Reduced number of tickets per Mac | Composite organization | 50% | 50% | 50% |
| A8 | Average cost to resolve tickets per PC | Composite organization | $30 | $30 | $30 |
| A9 | Reduced cost to resolve tickets per Mac | Composite organization | 25% | 25% | 25% |
| A10 | Subtotal: support costs for PCs | D1*D2*A6*A8 | $1,800,000 | $3,600,000 | $5,400,000 |
| A11 | Subtotal: support costs for Mac | D1*D2*A6*A7*A8*(1-A9) | $675,000 | $1,350,000 | $2,025,000 |
| A12 | Subtotal: reduced support costs | A10-A11 | $1,125,000 | $2,250,000 | $3,375,000 |
| A13 | Number of PCs managed per IT FTE | Composite organization | 200 | 200 | 200 |
| A14 | Number of Mac devices managed per IT FTE | Composite organization | 500 | 500 | 500 |
| A15 | Subtotal: reduced management costs (rounded) | (D1*D2/A13 – D1*D2/A14)*A4*2080 – A5 – A12 | $1,164,033 | $2,722,233 | $4,280,433 |
| At | Reduced IT support costs | A5+A12+A15 | $2,683,200 | $5,366,400 | $8,049,600 |
| Risk adjustment | ↓10% | ||||
| Atr | Reduced IT support costs (risk-adjusted) | $2,414,880 | $4,829,760 | $7,244,640 |
Benefit 2: Reduced And Avoided Hardware And Software Costs
Interviewed organizations described the following reduced and avoided costs due to the enterprise Mac deployment:
- While on average the Mac costs more upfront, this is partially offset by the cost of a comparable PC that the employee would otherwise need to order.
- Note – the cost of the Mac is incorporated into the financial model quantification in Cost 2: Hardware And Hardware Deployment Costs.
- There is no need to purchase an OS license or software update maintenance for Mac.
- The Mac underlying architecture and included security features obviate the need for some additional endpoint security licenses that are required for comparable PC deployments. Additionally, security patches for Mac are at no cost.
- Mac requires less energy to operate.
Based on the customer interviews, Forrester estimates for the composite organization:
- 10,000 employees are choosing Mac annually.
- The average cost for an enterprise PC is $1,200, and the machine maintains a 10% residual value after three years.
- OS license costs for PCs average $150 per year per machine.
- Additional endpoint security licenses for PCs average $40 per year per machine.
- Note that this number may be lower or higher for organizations, based on which endpoint solutions are replaced due to the underlying architecture and included security features for Mac.
- Mac requires 50% less energy to operate.
This benefit can vary due to uncertainty related to:
- Number of employees choosing Mac.
- Average cost for an enterprise PC and residual value after three years.
- Additional OS and security license costs for PCs.
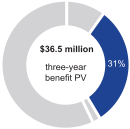
Reduced and avoided costs: 31% of total benefits
To account for these risks, Forrester adjusted this benefit downward by 5%, yielding an annual benefit ranging from $13.3 million to $15.9 million, with a three-year, risk-adjusted total PV of $36.5 million.
Benefit 2: Reduced And Avoided Hardware And Software Costs: Calculation Table
| REF. | METRIC | CALC. | YEAR 1 | YEAR 2 | YEAR 3 |
|---|---|---|---|---|---|
| B1 | Number of employees choosing Mac per year | Net new Mac devices; includes refreshes in Years 4 and 5 | 10,000 | 10,000 | 10,000 |
| B2 | Cumulative Mac devices deployed | D1*D2 | 10,000 | 20,000 | 30,000 |
| B3 | Average cost per PC | Composite organization | $1,200 | $1,200 | $1,200 |
| B4 | Residual value for PCs after three years | Composite organization | 10% | ||
| B5 | Additional OS license costs and maintenance | Composite organization | $150 | $150 | $150 |
| B6 | Additional endpoint security licenses | Composite organization | $40 | $40 | $40 |
| B7 | Subtotal: avoided PC costs (rounded) | B1*B3-B1*B3*B4+B2*(B5+B6) | $13,900,000 | $15,800,000 | $16,500,000 |
| B8 | Annual energy costs per PC | 60W, 8 hours per day | $14 | $14 | $14 |
| B9 | Reduced energy costs per Mac | Composite organization | 50% | 50% | 50% |
| B10 | Subtotal: reduced energy costs | B2*B8*B9 | $70,000 | $140,000 | $210,000 |
| Bt | Reduced and avoided costs | $13,970,000 | $15,940,000 | $16,710,000 | |
| Risk adjustment | ↓5% | ||||
| Btr | Reduced and avoided costs (risk-adjusted) | $13,271,500 | $15,143,000 | $15,874,500 |
Benefit 3: Reduced Risk Of Data Breach
Interviewed organizations noted that their Mac has a fundamentally more secure architecture than their PCs. This resulted in a reduced risk of security incidents, along with obviating the need for some of the security agents they ran on their PC machines (which is quantified in Benefit 2), especially when following Apple’s best practices in deploying and securing Mac devices.
Based on the customer interviews, Forrester estimates for the composite organization:
- An average of 200,000 records are at risk for a given data breach event.
- The likelihood of a data breach at an organization prior to Mac deployment was 14% per year, which is approximated from independent benchmark research conducted by the Ponemon Institute, “2018 Cost of a Data Breach Study”.1
- The average cost per lost or stolen record is $230, which is approximated from the US-based metrics found in the previously cited Ponemon Institute study.
- This benefit can vary due to uncertainty related to:
- Mac deployment in the enterprise is 10%, 20%, and 30% in Years 1, 2, and 3, respectively.
- Mac reduces the likelihood of a data breach by 50% per device. One customer noted that they experience as much as 90% fewer security incidents on their Mac devices.
This benefit can vary due to uncertainty related to:
- The number of records at risk per data breach event.
- The likelihood of a data breach.
- The adoption of Mac in the organization.
![]()
50% reduced likelihood of data breach per enterprise-deployed Mac
To account for these risks, Forrester adjusted this benefit downward by 5%, yielding an annual benefit ranging from $305,900 to $917,700, with a three-year, risk-adjusted total PV of $1.5 million.
Benefit 3: Reduced Risk Of A Data Breach: Calculation Table
| REF. | METRIC | CALC. | YEAR 1 | YEAR 2 | YEAR 3 |
|---|---|---|---|---|---|
| C1 | Average number of records at risk per data breach | Composite organization | 200,000 | 200,000 | 200,000 |
| C2 | Likelihood of data breach at an organization, prior to Mac deployment | Composite organization | 14% | 14% | 14% |
| C3 | Average cost per lost or stolen record | Composite organization | $230 | $230 | $230 |
| C4 | Percent Mac deployment | D2 | 10% | 20% | 30% |
| C5 | Reduced likelihood of data breach for Mac devices | Composite organization | 50% | 50% | 50% |
| Ct | Reduced risk of a data breach | C1*C2*C3*C4*C5 | $322,000 | $644,000 | $966,000 |
| Risk adjustment | ↓5% | ||||
| Ctr | Reduced risk of a data breach (risk-adjusted) | $305,900 | $611,800 | $917,700 |
1 “2018 Cost of a Data Breach Study: Global Overview,” Ponemon Institute, July 2018
Benefit 4: Improved Employee Performance And Engagement
Interviewed organizations described the following benefits related to improved employee productivity and engagement:
- Improved machine performance, including faster startup time, led to an increase in employee productivity, in addition to significantly reducing employee frustration with trying to accomplish work. Part of the improved startup time is due to the reduced need of additional security agents on the machine due to the more secure underlying architecture.
- Improved employee engagement due to the ability to choose a Mac as their work machine led to an increase in discretionary effort and performance (e.g., increased sales performance from the sales team).
- Improved employee engagement also led to a tangible benefit of improving the employee retention rate.
Based on the customer interviews, Forrester estimates for the composite organization:
Improved Productivity From Time Saved
- 100,000 total employees, of which 10% choose Mac in Year 1, which increases to 20% and 30% in Years 2 and 3, respectively.
- An average time of 5 minutes per day waiting for tasks like wake/reboot on a PC, compared to 1 minute for a Mac.
- An average fully burdened employee salary of $78,000.
- 20% of time savings is put toward more productive work (productivity capture).
Improved Sales Performance
- Of the employees choosing Mac, 30% of them are sales employees.
- An annual sales quota of $1 million per sales employee.
- A 5% increase in sales performance for employees choosing Mac, 20% of which can be attributed to Mac and the employee choice program.
- A 15% profit margin.
Improved Employee Retention
- Average employee churn rate for employees not choosing Mac is 15%.
- There is a 20% improvement in retention rate for employees choosing Mac.
- It costs 50% of an employee’s annual salary to replace an employee due to attrition (a conservative estimate compared to industry research performed by the Society for Human Resource Management).
This benefit can vary due to uncertainty related to:
- Number of employees choosing Mac, and average fully burdened salaries.
- Note that salary is a conservative estimate of the value an employee provides to the organization.
- Productivity capture.
- Improvement in productivity and retention rate.
- Profit margin.
- Cost to replace employees
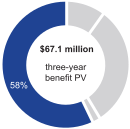
Improved employee engagement and performance: 58% of total benefits
To account for these risks, Forrester adjusted this benefit downward by 20%, yielding an annual benefit ranging from $14 million to $42 million, with a three-year, risk-adjusted total PV of $67 million.
Benefit 4: Improved Employee Performance And Engagement: Calculation Table
| REF. | METRIC | CALC. | YEAR 1 | YEAR 2 | YEAR 3 |
|---|---|---|---|---|---|
| D1 | Number of employees | Composite organization | 100,000 | 100,000 | 100,000 |
| D2 | % of employees using Mac | Composite organization | 10% | 20% | 30% |
| D3 | Average time for PC wake/reboot per day (min) | Composite organization | 5 | 5 | 5 |
| D4 | Average time for Mac wake/reboot per day (min) | Composite organization | 1 | 1 | 1 |
| D5 | Average working days per year | Composite organization | 240 | 240 | 240 |
| D6 | Average fully burdened employee salary (annual) | Composite organization | $78,000 | $78,000 | $78,000 |
| D7 | Average fully burdened employee salary (hourly) | Composite organization | $38 | $38 | $38 |
| D8 | Productivity capture | Forrester assumption | 20% | 20% | 20% |
| D9 | Subtotal: Improved productivity from quicker startup | D1*D2*(D3-D4)/60*D5*D7*D8 | $1,216,000 | $2,432,000 | $3,648,000 |
| D10 | Number of sales employees choosing Mac | D1*D2*30% | 3,000 | 6,000 | 9,000 |
| D11 | Average annual sales per sales employee | Composite organization | $1,000,000 | $1,000,000 | $1,000,000 |
| D12 | Increase in sales performance for employees choosing Mac | Composite organization | 5% | 5% | 5% |
| D13 | Improved performance attributed to Mac and employee choice | Composite organization | 20% | 20% | 20% |
| D14 | Profit margin | Composite organization | 15% | 15% | 15% |
| D15 | Subtotal: Improved sales performance | D10*D11*D12*D13*D14 | $4,500,000 | $9,000,000 | $13,500,000 |
| D16 | Average employee churn rate for employees not choosing Mac | Composite organization | 15% | 15% | 15% |
| D17 | Improvement in retention rate with employees choosing Mac | Composite organization | 20% | 20% | 20% |
| D18 | Cost to replace employee | D6*50% | $39,000 | $39,000 | $39,000 |
| D19 | Subtotal: Improved employee retention | D1*D2*D16*D17*D18 | $11,700,000 | $23,400,000 | $35,100,000 |
| Dt | Improved employee productivity and engagement | D9+D15+D19 | $17,416,000 | $34,832,000 | $52,248,000 |
| Risk adjustment | ↓20% | ||||
| Dtr | Improved employee productivity and engagement (risk-adjusted) | $13,932,800 | $27,865,600 | $41,798,400 |
Analysis Of Costs
QUANTIFIED COST DATA AS APPLIED TO THE COMPOSITE
Total Costs
| REF. | COST | INITIAL | YEAR 1 | YEAR 2 | YEAR 3 | TOTAL | PRESENT VALUE |
|---|---|---|---|---|---|---|---|
| Etr | Implementation and labor costs | $136,620 | $308,568 | $308,568 | $308,568 | $1,062,324 | $903,983 |
| Ftr | Hardware and hardware deployment costs | $0 | $8,253,000 | $14,626,500 | $16,537,500 | $39,417,000 | $32,015,612 |
| Total costs (risk-adjusted) | $136,620 | $8,561,568 | $14,935,068 | $16,846,068 | $40,479,324 | $32,919,595 |
The table above shows the total of all costs across the areas listed below, as well as present values (PVs) discounted at 10%. Over three years, the composite organization expects risk-adjusted total costs to have a PV of $33 million.
Cost 1: Implementation And Labor Costs
Interviewed organizations noted implementation and ongoing internal labor costs for platform support.
Based on the customer interviews, Forrester estimates for the composite organization:
-
$50,000 is spent on professional services for implementation.
-
Two IT FTEs spent 20 weeks on implementation activities, at an average fully burdened salary of $43/hour.
-
Three IT FTEs are needed for ongoing platform support.
This cost can vary due to uncertainty related to:
-
Required implementation professional services.
-
Required implementation and ongoing support.
-
Fully burdened IT salary.
To account for these risks, Forrester adjusted this cost upward by 15%, yielding an initial cost of $136,620, an annual cost of $308,568, and a three-year, risk-adjusted total PV of $903,983.
Implementation risk is the risk that a proposed investment may deviate from the original or expected requirements, resulting in higher costs than anticipated. The greater the uncertainty, the wider the potential range of outcomes for cost estimates.
Cost 1: Implementation And Labor Costs: Calculation Table
| REF. | METRIC | CALC. | INITIAL | YEAR 1 | YEAR 2 | YEAR 3 |
|---|---|---|---|---|---|---|
| E1 | Professional services | Composite organization | $50,000 | |||
| E2 | Internal implementation FTEs | Composite organization | 2 | |||
| E3 | Average fully burdened IT salary (hourly) | C4 | $43 | $43 | $43 | $43 |
| E4 | Implementation time (weeks) | Composite organization | 20 | |||
| E5 | Ongoing platform support (FTEs) | Composite organization | 3 | 3 | 3 | |
| Et | Implementation and labor costs | E1+E2*E3*E4*40+E5*E3*2,080 | $118,800 | $268,320 | $268,320 | $268,320 |
| Risk adjustment | ↑15% | |||||
| Etr | Implementation and labor costs (risk-adjusted) | $136,620 | $308,568 | $308,568 | $308,568 |
Cost 2: Hardware And Hardware Deployment Costs
Interviewed organizations noted hardware and deployments costs related to the Mac itself, a third-party MDM, an incremental cost for additional Mac peripherals, and AppleCare support.
Based on the customer interviews, Forrester estimates for the composite organization:
-
An incremental 10,000 Mac devices are deployed each year.
-
The average cost for a Mac is $1,700, and is estimated to maintain a residual value of 25% after three years. Additionally, with Apple Financial Services, the Mac could be financed. For this example, the Mac is placed on a three-year lease, allowing the upfront cost to be spread over three years. For simplicity, the analysis does not include the cost of interest.
-
Note that this average cost for Mac is dependent on the distribution of machines purchased. For example, this could be higher if employees focused more on top-end MacBook Pros, or lower if more employees choose the MacBook Air.
-
-
Average annual cost for a third-party MDM is $40 per Mac.
-
Note that the price for a third-party MDM may vary depending on size of deployment, hosting requirements, and required implementation or integration costs.
-
-
Average cost for additional Mac peripherals is $50 upon deployment.
-
Average cost for AppleCare for Enterprise (three-year service contract) is $129 per Mac upon deployment when there are more than 5,000 Apple devices deployed in the enterprise.
This cost can vary due to uncertainty related to:
-
Cost of a Mac and residual value.
-
Annual cost of the third-party MDM.
-
Incremental cost for Mac peripherals and AppleCare support.
-
The use of Apple Financial Services or a competing provider to realize residual value upfront and optimize financial terms.
To account for these risks, Forrester adjusted this cost upward by 5%, yielding an annual cost ranging from $8 million to $17 million, with a three-year, risk-adjusted total PV of $32 million.
Cost 2: Hardware And Hardware Deployment Costs: Calculation Table
| REF. | METRIC | CALC. | INITIAL | YEAR 1 | YEAR 2 | YEAR 3 |
|---|---|---|---|---|---|---|
| F1 | Number of Mac devices deployed annually | B1 | 10,000 | 10,000 | 10,000 | |
| F2 | Cumulative Mac devices deployed | B2 | 10,000 | 20,000 | 30,000 | |
| F3 | Average cost per Mac | Composite organization | $1,700 | $1,700 | $1,700 | |
| F4 | Residual value for Mac after three years | Composite organization | 25% | |||
| F5 | Average annual cost per Mac with payments set over three years (rounded) | F3/3 | $567 | $567 | $567 | |
| F6 | Average annual third-party MDM cost per Mac | Composite organization | $40 | $40 | $40 | |
| F7 | Average cost for additional Mac peripherals | Composite organization | $50 | $50 | $50 | |
| F8 | Average cost for AppleCare per Mac | Composite organization | $129 | $129 | $129 | |
| Ft | Hardware and hardware deployment costs | F1*(F7+F8) + F2*(F5+F6) – (F1*F3*F4) | $7,860,000 | $13,930,000 | $15,750,000 | |
| Risk adjustment | ↑5% | |||||
| Ftr | Hardware and hardware deployment costs (risk-adjusted) | $8,253,000 | $14,626,500 | $16,537,500 |
Financial Summary
CONSOLIDATED THREE-YEAR RISK-ADJUSTED METRICS
Cash Flow Chart (Risk-Adjusted)
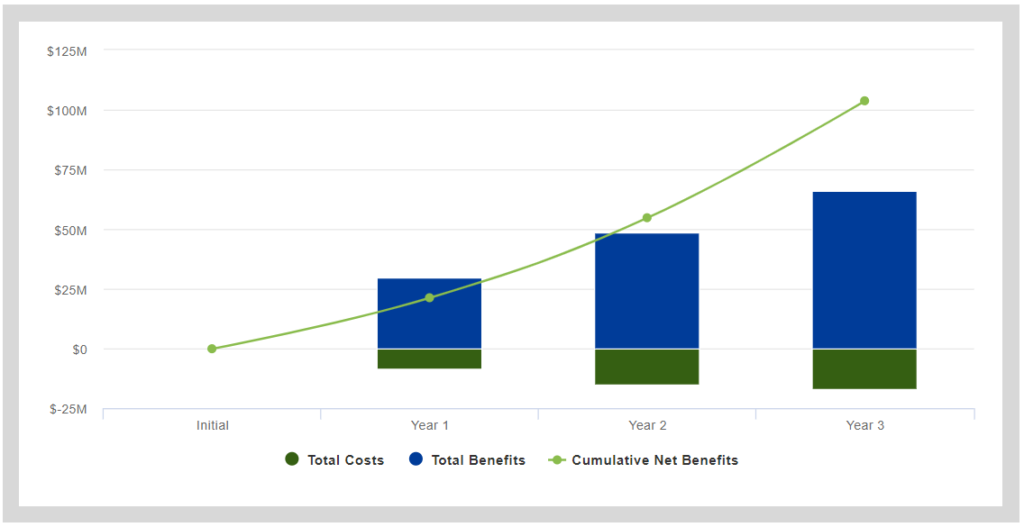
Cash Flow Analysis (Risk-Adjusted)
| INITIAL | YEAR 1 | YEAR 2 | YEAR 3 | TOTAL | PRESENT VALUE | |
|---|---|---|---|---|---|---|
| Total Costs | ($136,620) | ($8,561,568) | ($14,935,068) | ($16,846,068) | ($40,479,324) | ($32,919,595) |
| Total Benefits | $0 | $29,925,080 | $48,450,160 | $65,835,240 | $144,210,480 | $116,709,063 |
| Net Benefits | ($136,620) | $21,363,512 | $33,515,092 | $48,989,172 | $103,731,156 | $83,789,468 |
| ROI | 255% | |||||
| Payback period | < 6 months |
The financial results calculated in the Benefits and Costs sections can be used to determine the ROI, NPV, and payback period for the composite organization’s investment. Forrester assumes a yearly discount rate of 10% for this analysis.
This study was conducted by Forrester’s Custom Content Consulting Practice. Get in touch to discuss your custom content needs and goals. And to learn more about all of Forrester’s consulting capabilities, click here.
Appendix A: Total Economic Impact
Total Economic Impact is a methodology developed by Forrester Research that enhances a company’s technology decision-making processes and assists vendors in communicating the value proposition of their products and services to clients. The TEI methodology helps companies demonstrate, justify, and realize the tangible value of IT initiatives to both senior management and other key business stakeholders.
Total Economic Impact Approach
The initial investment column contains costs incurred at “time 0” or at the beginning of Year 1 that are not discounted. All other cash flows are discounted using the discount rate at the end of the year. PV calculations are calculated for each total cost and benefit estimate. NPV calculations in the summary tables are the sum of the initial investment and the discounted cash flows in each year. Sums and present value calculations of the Total Benefits, Total Costs, and Cash Flow tables may not exactly add up, as some rounding may occur


